


Create Density Map
Purpose
This tool is provided for creating density raster maps.
Description
The tool allows calculating density rasters for point and polyline features in a specified neighborhood. You can use the tool to calculate density for landmark points and lines, utility and transportation lines etc.
Usage
-
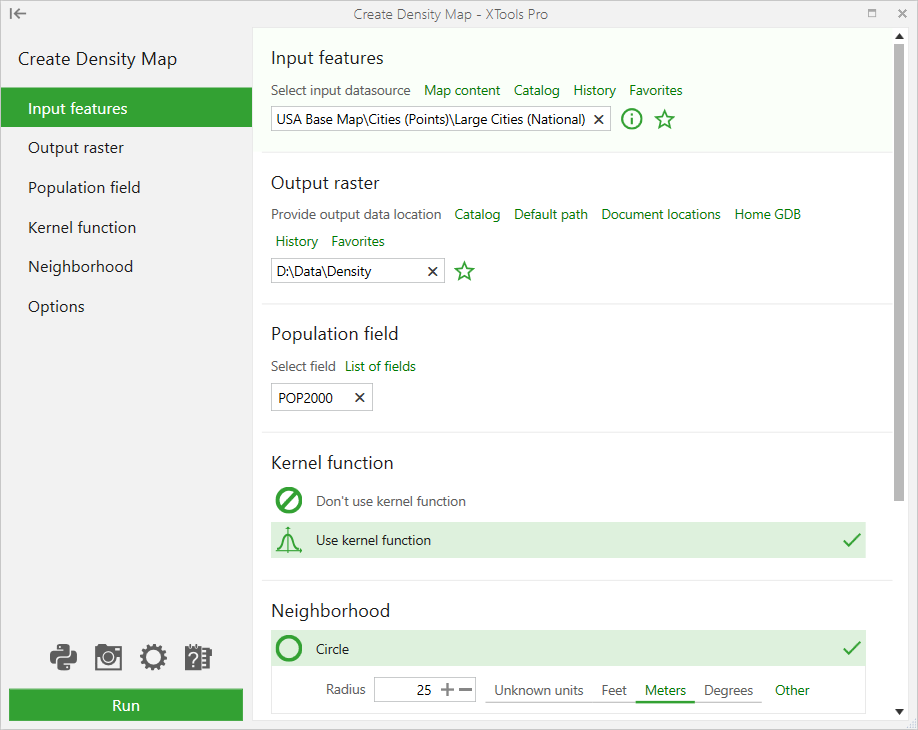
Select the "Create Density Map" tool from the XTools Pro Surface Tools menu.
-
Select the input layer containing points or polylines to calculates density for.
-
Specify the name and location of the output raster dataset.
-
Select an appropriate population field.
If the field is not specified, the density of spatial feature locations will be calculated. -
Select if you wish to use kernel function.
-
Specify neighborhood and its parameters.
-
Specify cell size and neighborhood area units.
-
Press Run to calculate density raster.
Kernel function
-
Use kernel function
The tool allows calculating the density for each output raster cell using kernel function (for both points and lines).
Quartic density function value (with kernel function based on a ratio of a distance from the cell center to each feature in a neighborhood and the neighborhood radius) is multiplied by Population field value (if specified) for each input feature in the neighborhood. The summarized quartic function value for all features in the neighborhood per neighborhood area unit is the output density result in the cell.
Using kernel function is the default option. Being available for only Circle and Ellipse neighborhood types it allows using a kernel function to fit a smoothly tapered surface to each input feature.
-
Don't use kernel function
In this case, calculating the input features density for each output raster cell is based on count of features (for points) or lengths of features part (for lines) in the cell neighborhood.
For points the output density result is a sum of Population field values (if specified) for each feature or count (if Population field is not specified) of features in the neighborhood divided by neighborhood area. For lines the output density result is a sum of lengths of each feature part in a neighborhood multiplied by the matched Population filed values (if specified) and divided by the neighborhood area.
Wedge neighborhood type is only available for input points.
Neighborhood types
There are following neighborhood types available.
-
Circle - a circular neighborhood with the given radius.
-
Ellipse - an elliptical neighborhood with the specified major/minor radius and rotation angle.
-
Annulus - a torus (or donut) neighborhood defined by an inner radius and an outer radius.
-
Rectangle - a rectangular neighborhood with the given width and height.
-
Wedge - a wedge (pie) neighborhood. A wedge is specified by a start angle, an end angle, and a radius. The wedge extends counterclockwise from the starting angle to the ending angle. Angles are specified in arithmetic degrees (counterclockwise from the positive x-axis). Negative angles may be used.
Unlike the standard functionality for calculating density in ArcGIS this tool combines all Create Density Map options.
Default output raster format and density map extent can be changed (see XTools Pro Options).