Feature Report
#updated
Purpose
Feature Report tool allows creating reports on the selected features.
Description
XTools Pro Feature Report tool is an additional and alternate way for creating reports in ArcGIS. Feature Report display feature geometry and include attribute and geometry information derived from the selected features. Created reports can be modified, printed or exported to MS Word application for editing or to PDF file for distribution purposes.
Currently there are three report templates provided with the tool:
-
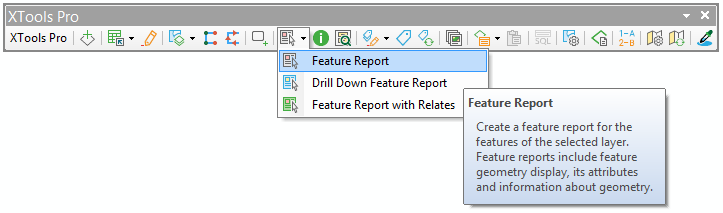
Feature Report
-
Feature Report with Relates
-
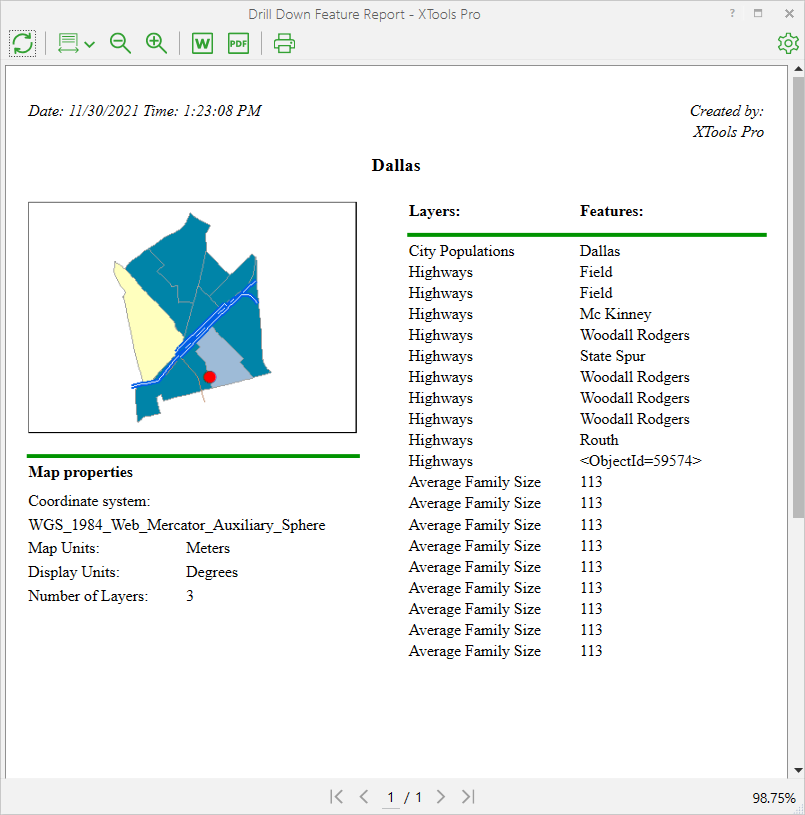
Drill Down Feature Report
Feature Report contain information about a selected feature of a feature layer: feature geometry, attributes and geometry properties. Feature can be drawn as a simple contour, drawn with a current symbol used in the map, or a part of the map with all other layers can be displayed.
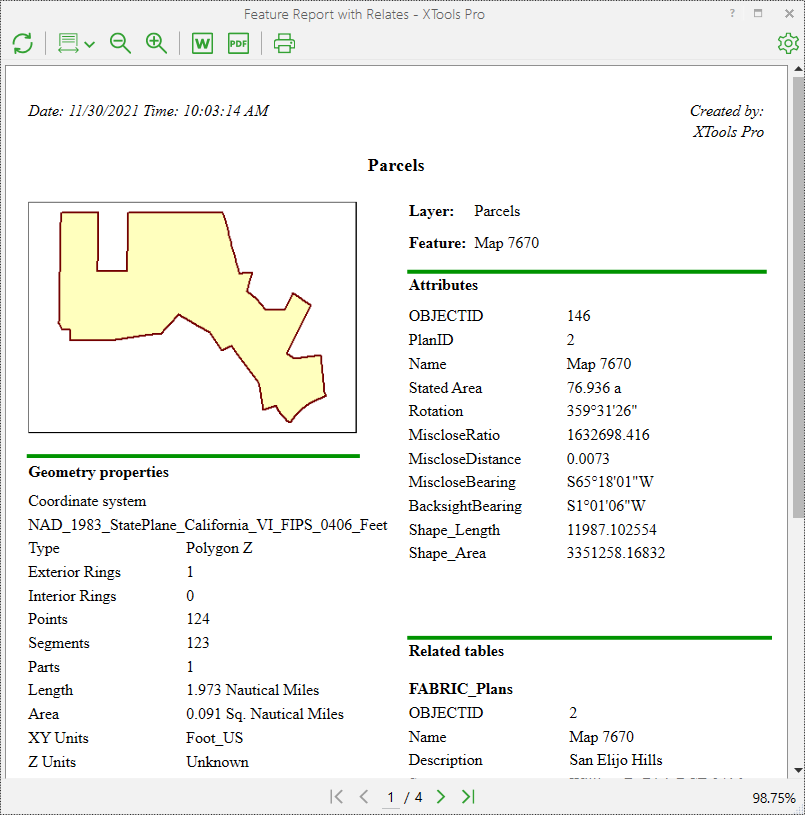
Feature Report with Relates are basically the same as simple feature reports but in addition they allow to display the relates if any tables are related to the feature class.
Drill Down Feature Report display information about all the visible map layers found in the selected area: features geometry, coordinate system, units, number of layers, layer names and features attributes (displayed attribute is taken from the layer's display field).
Besides, Feature Report also supports joined fields. If there are any tables joined to the target feature class attribute table, then by default joined attributes will be displayed in reports. At that, there is an option in the report properties allowing to hide joins.
The following feature layer types are supported:
-
gdb, mdb, sde feature layers (points, multipoints, lines, polygons, multipatches, dimensions)
-
gdb, mdb, sde mosaic dataset sublayers (boundary and footprint)
-
gdb, mdb, sde parcel fabric feature layers (points, lines, polygons)
-
gdb, mdb schematic feature layers (points, lines, polygons)
-
shapefiles (points, multipoints, lines, polygons, multipatches)
-
coverage feature layers (points, lines, polygons)
-
gpkg feature layers (points, multipoints, lines, polygons)
-
CAD dwg, dxf, dgn feature layers (points, lines, polygons, multipatches)
-
gpx feature layers (points, lines)
-
selection layers
-
feature services (points, lines, polygons)
The following layer properties are supported:
-
layer aliases
-
feature symbols
-
definition queries
-
display field
-
field aliases
-
fields visibility
-
fields order
-
numeric field format
-
joined fields
Creating Feature Reports
To start creating reports with the Feature Report tool select the tool in the XTools Pro toolbar and a report template to be used:
If you choose to create Feature Report then you need to select one or several feature layers in the table of contents. After that you can select a map area with the required features. The feature report is generated in a separate window for all features of the selected layer in that map area. Features from another layer or another map area can be added to the generated report holding Shift key when selecting map area. Features selected for the report are flashed on the map.
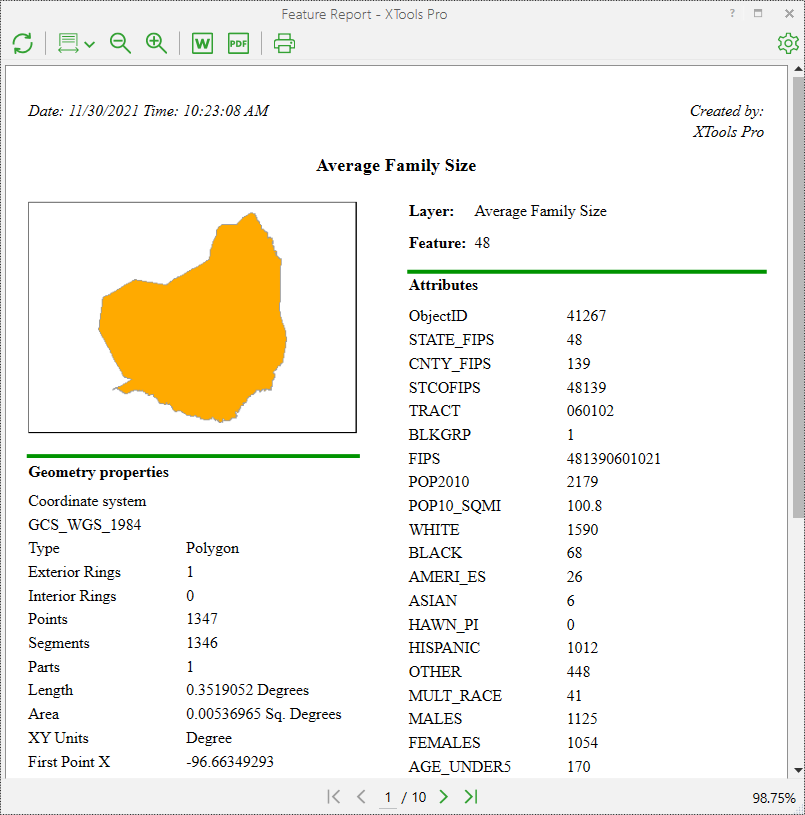
Attributes values in Feature Report are displayed according to the fields settings specified in the layer properties.
Feature Report with Relates created on the features with related tables display an additional section "Related tables" in the lower right corner (or on the next pages if there are too many attribute fields):
If you choose to create Drill Down Feature Report then you do not need to select a layer in the table of contents window. Just select an appropriate map area with the Drill Down Feature Report tool. Drill Down Feature Report will be generated and displayed in a separate window. Layers order in Drill Down Feature Report is the same as the layers order in the table of contents.
Working with the generated report
In the Feature Report dialog you have a few options with the generated report, that listed on the top (part of these is available with hot keys):
-
Refresh
If some properties of the selected layer have been changed (i.e. symbology or field properties), you can just refresh the generated report to see the changes in it. -
Zoom options
You can specify the report display zoom level (from 10 to 400 %). You can also zoom in the report or out if required. At that, the whole page of the generated report or only the report page width can be fit to the tool window. -
Export to Word file
The report can be exported to Microsoft Word file. -
Export to PDF file
The report can be exported to PDF file. -
Print
The report can be printed out.
You can use navigation buttons to view other report pages.
Options
The report modification capabilities include the following options:
General
-
Title
Active data frame name, which is different from the default names (Layers or New Data Frame), is taken as the report title by default. Otherwise, the name of opened MXD document can be the default report title. But you can specify another title, that is kept in the current ArcMap session. -
Author
User's name is used as the report author by default. Other specified author is kept between ArcMap sessions. -
Show joined fields
When this option is selected (by default), the joined fields are shown in the list of feature attributes in the report. -
Show geometry info
When this option is selected (by default), the information about feature geometry is shown in the report.
Measurements
-
Unknown units
Units can be specified for the layers with Unknown spatial reference. The units is used to calculate and display the reported feature length (or perimeter) and feature area in the Output units. Unknown units are the current map units by default. -
Output units
You can changed the output units to display the length (or perimeter) and area of the reported feature. Default output units are the units of the data source spatial reference. Specified output units are kept between ArcMap sessions. -
Spatial reference
You can select another spatial reference to calculate and display the reported feature length (or perimeter) and feature area. By default the data source spatial reference is used.
Drawing
-
Draw feature contour
Only feature contour is displayed in the report. -
Draw feature symbol
Only feature symbol is displayed in the report. -
Draw clipped map
A clipped map area is displayed in the report. The map area can be clipped by feature or by current extent. -
Mark feature
The reported feature is marked by selection color in the clipped map area.
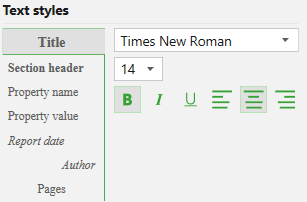
Text styles
You can specify your own font and font size for different parts of the report. Also the text can be made bold, italicized, or underlined and aligned with the left or right side, or centered. For your convenience, names of the text styles are displayed in the customized styles.
The following text styles can be customized:
-
Title
-
Section header
-
Property name
-
Property value
-
Report date
-
Author
-
Pages
All changes are applied immediately. Please note that the changes are kept in the current ArcMap session only.