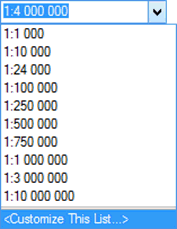
Scale Manager
Purpose
This tool is provided for working with scales of the map elements, such as layers, groups of layers, and label classes. The scale managing is done interactively in a one-window mode.
Description
In order to set the map display at different scales, you need to do a number of standard monotonous operations. Besides, by doing so, it is impossible to get the full picture, for which layers and what scales are set.
The Scale Manager tool may be a perfect solution for work with the map scales, no matter how complex the layers structure your maps have.
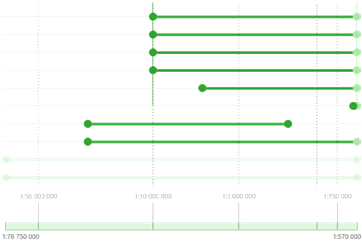
The scale range at which the layer will be visible is shown as a rectangle with active left and right borders. The rectangle on the scale bar shows the minimum and the maximum display scales. The scales are managed either via dragging the appropriate rectangles or their active borders. In addition to the layers scale ranges, the scale ranges of the group layers and label classes are shown.
One of the tool features is the automatic correction of the scale range value to +1 or -1, depending on the bound type.
Managing scales
The tool is active if there is at least one layer added in the TOC. The tool dialog consists of the following parts:
1. The map TOC.
2. The scale range area (the main workspace).
3. The controls for fitting the scale ranges to visible area bounds.
4. The settings for scale ranges behavior and display.
5. The scale.
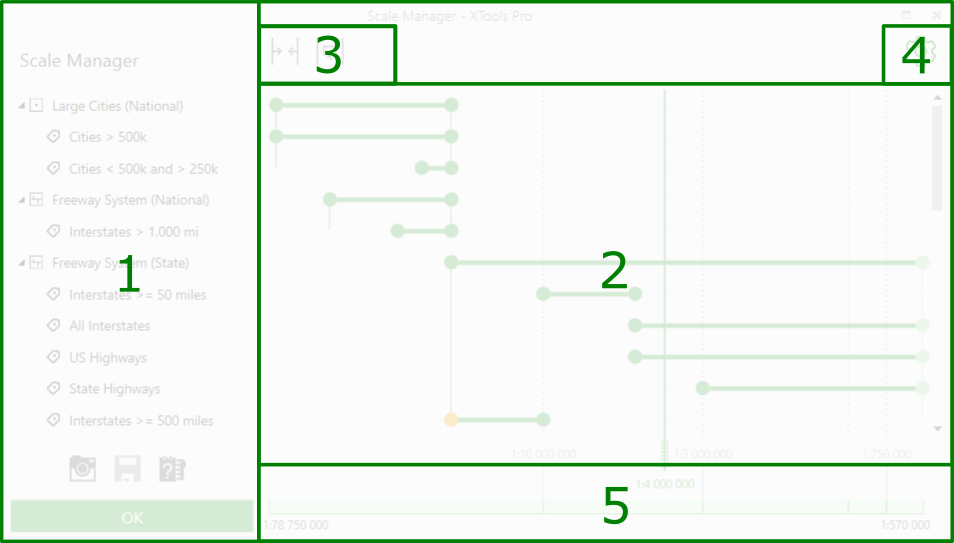
When you open the tool dialog in the TOC, the elements for which the scale ranges are set, are automatically expanded and their scale ranges are shown in the workspace. The remaining elements of the map stay collapsed, but they can be expanded manually.
Scale ranges
For each layer, group of layers or label class the minimum and the maximum scale can be set. These values define the visibility scale range.
|
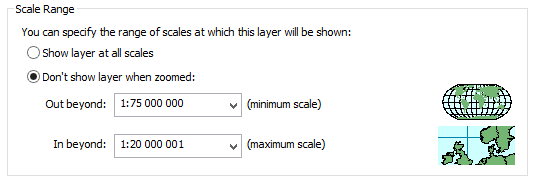
The Scale Range dialog in ArcMap
|
|
The scale range in the Scale Manager tool
|
The scale ranges locate near the appropriate elements in the TOC and show the nested structure.
How to set the scale range bounds
Each scale range has three active elements, such as minimum and maximum bound and the scale range rectangle. Each of the above elements can be moved along the horizontal axis and so the scale value is changed.
Setting the scale range values is done as follows:
1. Move the minimum and/or maximum scale range bound.

2. Move the whole scale range.

3. Enter the scale range value manually. To do so, double-click the scale range bound, type the required value, and press Enter.
Please note, that in this case the scale bound will automatically become closed!
4. Delete the scale range value. This is done in two following ways:
· Enter 0 as the scale value,
· Hold the scale range bound and move it beyond the workspace.

5. Create the new scale range. For areas, where scale range has not yet been set, it is marked as the assumed scale with the visibility bounds of the entire map or of the element, where it is nested. Such assumed scale range is shown barely noticeable. In order to create bounds for this range, you need to either move at least one of its bounds or to manually enter the required value.
|
Assumed location of the scale range in the group layer |
Setting the scale range bound value |
|
|
|
While moving the range bound with the mouse, it can be snapped to such elements as the bounds of other scale ranges, the map scale grid, and the scale range indicator. The appropriate tooltip will show to which element the scale bound will be snapped.
The snapping option can be disabled in settings, where you can also set the required snapping area value.

Scale range bounds
The scale range bound (both minimum and maximum) can be closed, opened or nominal. The settings define the default bound type used for the new created scale ranges.
1. Closed bound.
|
|
This is the regular bound type and its scale range value is never corrected automatically. Use this type to be able to manage the scale ranges by your own. |
2. Opened bound.
|
|
This bound type is used if you need to exclude the set scale value from the visible area. By saving the opened bounds the scale value is corrected (+1 for maximum scale and -1 for minimum scale). If the scale bound has not been changed, its value is not corrected. |
|
|
Example 1. The bounds define the scale range from 20 000 to 1 000, the left bound is closed, the right bound is opened. In this case, at scale 20 000 this layer will be visible. At scales larger than 20 000 (i.e. from 20 000 up to and including 1 001) the layer features will be shown on the map, whereas at scale 1 000 this layer will be hidden because the right bound is opened and the actual layer visibility varies from 20 000 to 1 001. The correction for the opened bound is +1.
|
|
|
Example 2. The bounds define the scale range from 20 000 to 1 000, the left bound is opened, the right bound is closed. This means that at scale 20 000 the layer will not be shown, whereas at scales ranging from 19 999 up to and including 1 000 the layer will be shown. So, the actual layer visibility varies from 19 999 to 1 000. The correction for the opened bound is -1.
|
|
|
Example 3. The bounds define the scale range from 20 000 to 1 000, both the left and the right bounds are closed. This means that the layer will be visible both at scale 20 000 and at scale 1 000 as well. The actual layer visibility varies from 20 000 up to and including 1 000. |
3. Nominal bound.
|
|
If the element has no set visibility scale but it is included to the group, the Scale Manager tool shows the actual visibility of the element in such a way. That is, if the nested element does not have set scale range, its visibility on the map will still be defined by the visibility of the element it is nested in. By moving the nominal bound you can set its required value and it will become closed or opened depending on the settings. |
Note:
The bound type influences only the newly created scale ranges and ranges that have been moved with the mouse. The correction is done only upon the first saving after the bound has been changed. The correction is not applied to ranges which values have been entered manually.
Work with groups
Group elements. To groups refer the group layers and the layers with label classes. The groups have specific appearance. Each group has vertical lines drawn on the left and on the right, that show which elements belong to this group.
If you hover the mouse over the group, the area covering all elements of this group will be highlighted in addition to vertical lines.
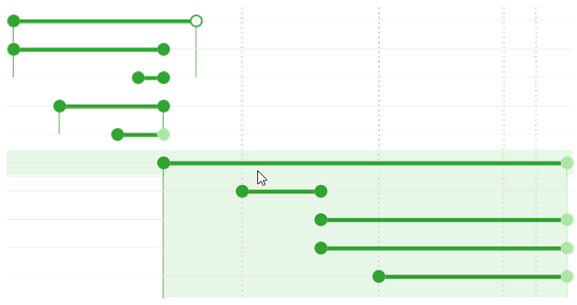
Moving the group. The group is moved same way as the scale range. Though, if the “Move groups as a whole” option is enabled in the settings, all elements nested in this group will be moved.
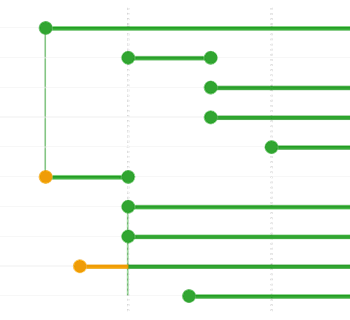
Overriding the group borders. If some of the nested elements overrides the group border, it is marked with a bright color. This means that this element will not be shown at those scales, where it is highlighted.
Managing the workspace
The following options are used for managing the workspace:
|
|
Fit visible area bounds to the map scale ranges. |
|
|
|
The scale ranges will be located in the workspace in such a way to reduce the areas that are not covered by both minimum and maximum scales as much as possible. That is, all scale ranges will fit the workspace. |
|
|
|
Reset visible area bounds. |
|
|
|
The scales display will be reset to the initial view when the tool has been launched. The reset is done considering all the changes made in the scales, so the workspace view may differ from the initial view, because the bounds are defined based on the full map extent. The values of scale ranges are not changed. |
|
|
|
||
|
|
Settings. |
|
|
|
The settings allow selecting the scale type and the default bound behavior, adding the service elements to the workspace and managing the snapping parameters. |
|
Scale type
There are two types of scale available with the tool. The scale type and its direction are set in the settings.
Linear scale. If this scale type is selected, all the scales values in the workspace are spread evenly. The linear scale can be used when the scales are spread more or less evenly and have similar interval length (the difference between the minimum and the maximum scale value).

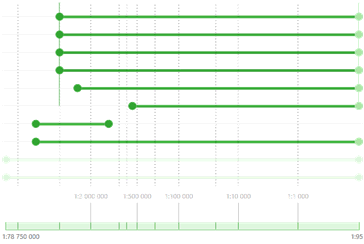
Logarithmic scale. The key feature of this scale type is that the scale density increases for smaller scales. Since ranges of large scales of most of the maps have small intervals, and small scales – bigger intervals, the logarithmic scale may be very suitable to display the visibility scale ranges.

Besides the scale type, you can set the scale direction from minimum scale to maximum scale.
|
|
Maximum to minimum. |
|
|
Minimum to maximum. |
Map scale grid
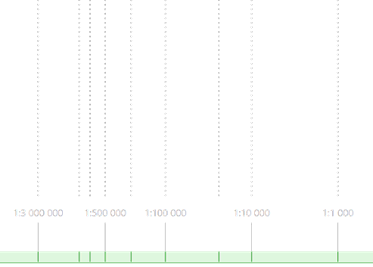
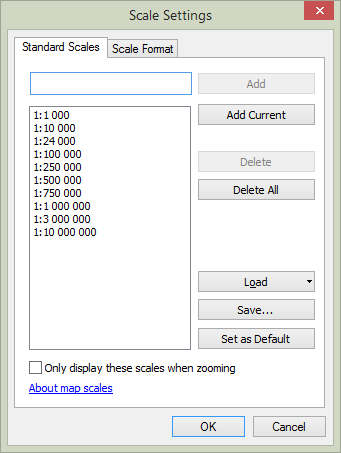
The tool workspace contains another service element, the map scale grid. This grid corresponds to the scales of the ArcMap document.
By default, the option of snapping the range bounds to the scale grid is enabled. To disable the snapping option or to change the snapping area size, go to the settings section.
|
|
|
For editing the map scale grid the standard Scale Setting tool in ArcMap is used.
Scale indicator
One more service element available in the workspace is the Scale indicator. The Scale indicator is a vertical line that can be freely moved using the handle. The scale bounds can be snapped to the scale indicator the same way as they snap to the map scale grid. The snapping option can be disabled and the size of the snapping area can be changed in the settings.
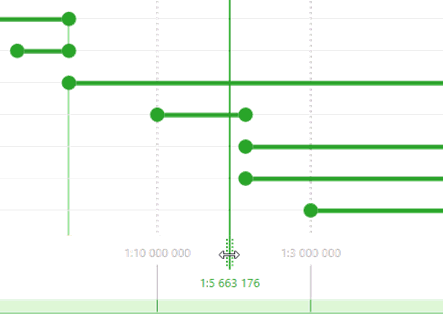
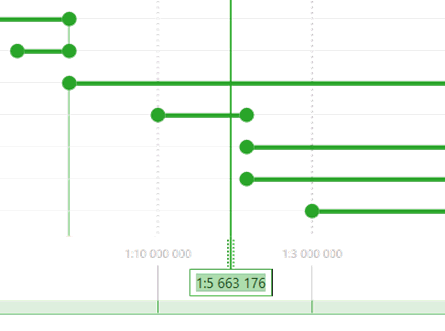
By opening the tool dialog, the scale indicator will be set to the value corresponding to the current map scale. In order to move the indicator, hold its handle and move it to the required place. If you need to set the scale indicator to some precise position, double-click the indicator label, type the value, and press Enter.
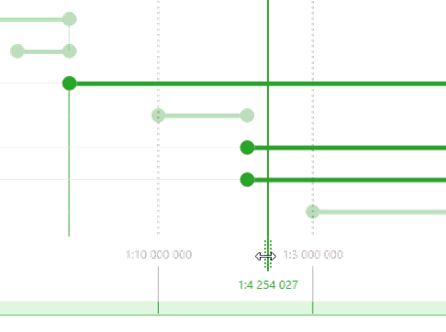
By moving the scale indicator the scale ranges appearance changes. The scale ranges that will be visible at the map scale equal to the scale set in the scale indicator, will look bright-colored. Those scale ranges that will not be visible, will look light-colored.
That is, by using this option you can promptly see the behavior of map elements at different scales.
Settings
The settings consist of a number of groups that manage the workspace view and the visibility of service elements.
Scale type.
Two scale types are available: linear and logarithmic, which are used depending on the map.
Map scale grid.
The group of settings provided for managing the scale grid visibility and its labels found in the map workspace.
Scale direction.
For ease of perception of information shown in the workspace, the scale direction can be changed. There are two options of setting the scale direction available: from minimum scale to maximum scale and vice versa.
Snapping.
While moving the range bounds, they can be snapped to the bounds of other scale ranges, the map scale grid, and the scale range indicator. In this group of settings you can disable the snapping option and also change the snapping area size.
Bound types.
This group of settings is provided to set the default bounds behavior by creation of new scale ranges or by editing the existent bounds. There are three variants available: both bounds are closed, the maximum bound is closed/the minimum is opened, the maximum bound is opened/the minimum is closed.
Additional settings.
Additional settings are provided for managing the visibility of the scale indicator, the visibility of the group bound and its highlighting on hover, as well as for disabling the option of moving the groups as a whole.


