


Getting started with AgroKarta
Assume you have the following:
-
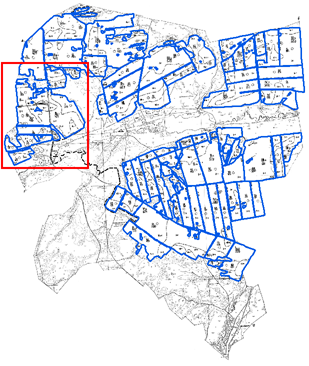
a farm unit hardcopy map, scanned and digitized by the fields;
-
the data related to the chemical elements content.
Using AgroKarta you will be able to:
-
separate the polygons into the farming contours and simple plots;
-
import the chemical elements data;
-
render and label the simple plots;
-
generate statistic reports by the farm unit and fields.
The steps of working with the data using AgroKarta are shown below:
Step 1. Manual polygon features separation
Step 2. Separating the farm unit layer into parts
Step 3. Separating the field into the simple plotsStep 4. Showing the simple plots numbers on map
Step 5. Simple plots numbering
Step 6. Importing chemical elements data
Step 7. Generating summary tables
Step 8. Showing chemical elements data on map
Step 9. Rendering simple plots by chemical elements
Step 10. Calculating simple plots area
Step 11. Deleting unused simple plots
Step 12. Synchronizing layer name with total plots area
Step 13. Generating report by chemical elements